Intro
GPUs are complex beasts - and certainly more mysterious in some ways than CPUs which come with ample amounts of documentation and manuals. Aspiring graphics programmers (too insignificant to have a devrel contact to give insight) are sometimes left to scrounge old GDC presentations on performance tips, with very little known about the inner workings of some GPUs.
 The classic glxgears, smoke test and demo for mesa OpenGL.
The Linux graphics stack is a beacon of light in this murky world, providing a wealth of insight into the inner workings. AMD also has an excellent initiative of publishing documents about hardware, including ISA manuals (unfortunately the “3D registers” documents are no longer published for new architectures).
When graphics shader debugging was brought up in the Graphics Programming Discord server recently, I got curious, as I had previously seen references to shader debugging in the AMD ISA manuals. It turns out @ishitatsuyuki has done some sleuthing on how things are done on the GPU compute side - including finding compute wave save/restore and the related host-side management, but the conclusion was that graphics waves cannot be saved and restored, since one would need to save and restore the fixed function state of the rasterizer and framebuffer. However, upon discussion with Ishi the wave management commands seemed to be still applicable. Furthermore, the existence of umr (AMD’s user-mode debugging facility for Linux) also hinted at the possibility of manipulating waves for graphics.
And so I began digging deeper, learning things as I went, which I will try to share here. By the end of this blog series, I will show a proof-of-concept implementation of all the relevant bits for a true hardware-based debugger on AMD GPUs on Linux, which lets us manipulate the state of the GPU directly from the host to debug the state of graphics and compute shaders.
But first, a brief overview on the current state of GPU tooling to see what is available when GPU programs go wrong.
Current state of GPU tooling on PC
The GPU scene is divided into Graphics and Compute. For Compute, one can get the amenities known on the CPU - CUDA and ROCm have proper debuggers, supporting breakpoints, watchpoints, single stepping and so on.
For Graphics, the tools are instead trace based. NSight (NVidia’s offering), RGP (AMD’s offering) and RenderDoc all work on the basis of trace replaying. What this means is that when you make a capture with RenderDoc, your API calls are intercepted and recorded.
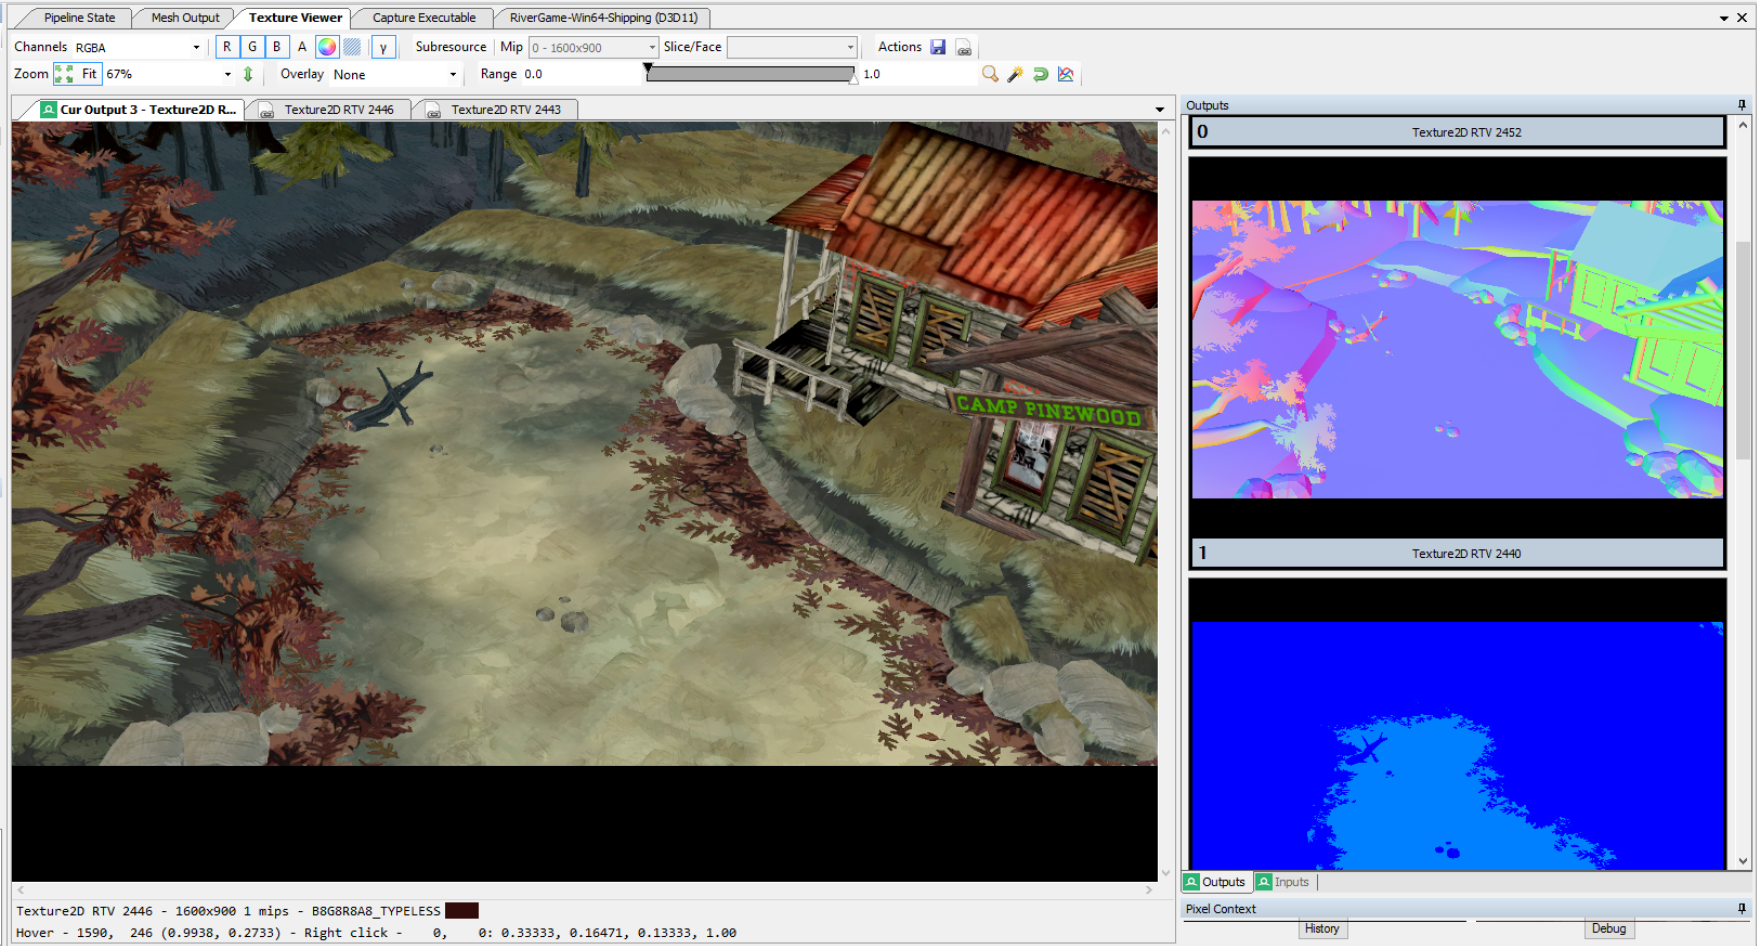 Sample screenshot of a RenderDoc session with various intermediate textures.1
You can then review the state of your application during the capture via RenderDoc replaying the commands of the application for you. RenderDoc also offers shader debugging achieved by a form of CPU/GPU hybrid emulation of the shader code. Since shader behaviour has a lot of implementation dependence, for faithful replay RenderDoc compiles small snippets of shader code, which are ran when the program is stepped, while the shader state is maintained in memory. The disadvantage of such emulation is that due to computational requirements, emulating larger bodies of work is not currently done, essentially providing a single threaded view of the execution (no cross-invocation or cross-subgroup communication).
Another difficulty is device loss. With Vulkan allowing the use of GPU virtual memory addresses and arbitrary computation on them (buffer device address), memory violations have become commonplace. While accesses through descriptors can be made robust (out of bounds reads return 0, writes are discarded), no such facility is available for direct virtual memory access. Diagnosis is still quite limited - although the VK_EXT_device_fault extension exists, there are no implementations yet. Both NVidia and AMD offer a breadcrumbs API in the form of VK_NV_device_diagnostic_checkpoints and VK_AMD_buffer_marker. Essentially, the driver or the user writes some bits to a buffer before all suspect work items until the device hangs. After the hang, the buffer is examined and the last breadcrumb written points towards the culprit (hopefully).
As we see, the Graphics debugging is lagging behind Compute and certainly behind CPU debugging.
CPU debugging 101
Program debugging under Linux uses the ptrace syscall. Using this we can either signal that our process should be traced or attach to the program to be traced (called the inferior). The signals generated by the inferior are caught by the debugger. The debugger waits for a signal to happen, accesses the state of the inferior (reading / writing memory), then resumes it. Breakpoints are placed by rewriting the instruction to int 3 - a single byte instruction, that will cause the process to generate a SIGTRAP signal. It is also possible to set data breakpoints - these trigger when a piece of memory is written. This is provided by the hardware, for example x86 has a set of debug registers (DR0...DR3), where you can set the addresses you are interested in.
The most well-known debugger under Linux, GDB, is designed in a flexible way that decouples debugging interface from implementation by incorporating hardware/software-specific actions in separate modules called targets. Each target is responsible for translating debugging actions, such as setting a breakpoint or reading the stackframe, to architecture specific actions or instructions (for example a specific target exists for debugging programs on MIPS that understands the registers on the MIPS architecture). For a much more lengthy and detailed description see Howto: Porting the GNU Debugger .
rocgdb is AMD’s ROCm based gdb + custom target that can debug compute programs, which is not too far from what we would like, but it interacts with amdkfd, which is a separate Kernel Mode Driver from amdgpu, which graphics applications use.
But perhaps we could be inspired by what rocgdb does to the GPU? To get there, first a very short primer on how shaders are executed on AMD hardware.
GCN/RDNA shader execution 101
On GCN/RDNA the fundamental unit of execution is a wavefront, or simply wave. A wave executes SIMD-like instructions (compiled from your SIMT GLSL or later SIMT SPIR-V for example). A wave has its own set of general purpose registers (GPRs), some of which are scalar (SGPRs) storing only 1 value per wave, and some that are vector (VGPRs) storing as many values as the width of the SIMD2. Newer AMD hardware can execute shaders in wave32 or wave64 mode, which defines the width. Control flow is achieved via an explicit mask (exec) and scalar branching (s_branch, s_cbranch_*)3.
1
2
3
4
5
6
7
8
9
10
11
12
13
14
15
16
17
; scalar registers are denoted with s[start:end], vector registers with v[start:end]
; scalar load of 2 dwords from the address in s[0:1] + offset of 0x10 to s[4:5]
s_load_dwordx2  s[4:5], s[0:1], 0x10
; logical left shift of each element of v0 by 2, stored into v0
v_lshlrev_b32  v0, 2, v0
; wait for all outstanding scalar loads
s_waitcnt     lgkmcnt(0)
; add all the elements of v1 and v0 and store the result in v1
v_add_nc_u32  v1, v0, v1
; broadcast s3 into all elements of v2
v_mov_b32     v2, s3
; change the exec mask into 0x10, turning off all lanes except the 16th
s_mov_b64     exec, 0x10
; read the value in v1 that corresponds to the first active lane (16th), and store it into s3
v_readfirstlane_b32 s3, v1
; store the value of v1 through a buffer resource in s[4:7] with an offset of 24, with global coherence (L1 cache control)
buffer_store_dword v1, off, s[4:7], null offset:24 glc
Each wave also maintains some scalar registers that determine additional miscellaneous state - condition codes, statuses and other flags.
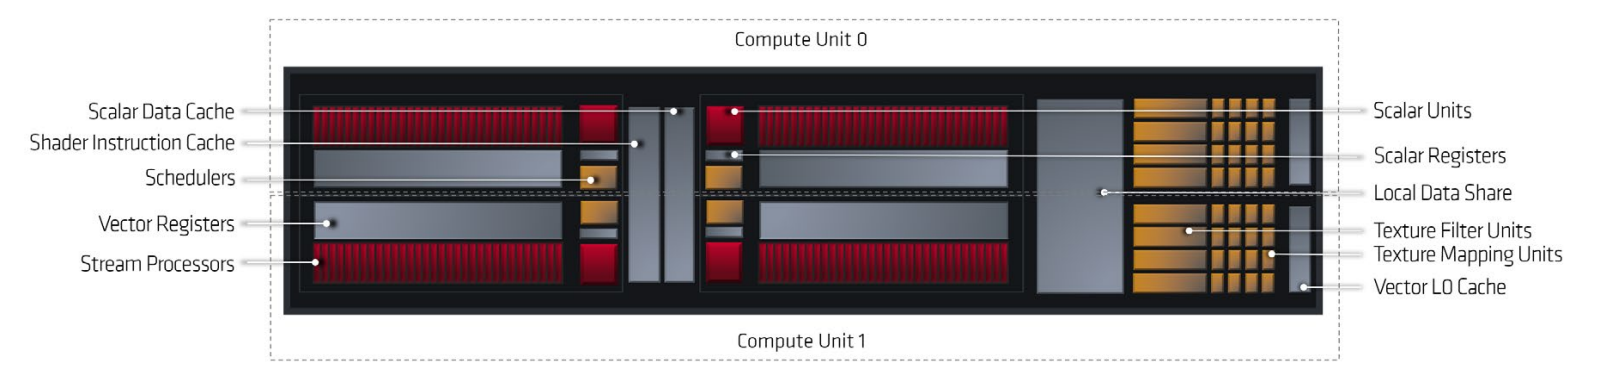 The schematic of an RDNA WGP, composed of two CUs.4
Each wave executes on a SIMD unit, which is part of a Workgroup Processor (WGP) and/or Compute Unit (CU). WGPs are organized further into Shader Arrays (SA or SH), which in turn compose into a Shader Engine (SE). In this way all waves on the device can be identified with this address (se.sa.wgp.simd.wave_id).
Graphics shaders have special hardware bits as well - vertex and pixel shaders need to perform an “export”, which passes data to the next pipeline stage.
How would the shader debugger work?
According to the ISA manual56, waves may have a trap handler - a small piece of shader program that can be run when the following happens:
- the trapping instruction (
s_trap #) is encountered - the shader encounters an unmasked exception - for example a floating point exception, or a memory violation
- the host tells the shader execution hardware that the currently running waves should enter the trap handler (host initiated trap)
- the wave is running in single stepping mode (
MODE.DEBUG_EN=1orMODE.TRAP_AFTER_INST=1) and has run an instruction - the wave is configured to enter the trap handler at the beginning or end of the wave (RDNA 36)
The trap handler can only be entered if a trap handler has been installed and enabled - this is shown by the wave’s STATUS.TRAP_EN register. If STATUS.TRAP_EN is 0, then all of the above are treated as NOPs - except for certain exceptions, like memory violation, which kills the wave.
Once the trap handler is entered, the wave gets elevated privileges (STATUS.PRIV=1) and gets to tamper with its own state more freely - a number of the STATUS register values become directly writable like STATUS.SCC. Additionally the wave gets 16 temporary trap scalar registers (ttmp0-ttmp15), which can be written while the wave has elevated privileges (but this requires that we tell the hardware of this before the wave launches, since it needs to allocate these additional registers to the wave7).
Armed with this knowledge, the battle plan is formed for making the debugger.
The Plan
- compile a trap handler
- upload the trap handler shader & install it and ask the wave to be launched with
ttmps reserved - invoke one of the above methods of triggering the trap handler for a specific wave
- use a piece of memory to communicate to the host (👋 hey host! i am in the trap handler now)
- if we want to breakpoint on an instruction instead of just the wave, we can now enable single stepping
- park the wave somehow until the host tells us to continue
- repeat entering the trap handler and waiting for the host as required
But there is a big issue - this Plan involves us hanging the GPU. Parking a wave means that the currently inflight work will not finish until the host is done - and this is a hang even though we will eventually resume the work. Since we can’t interact meaningfully with a hung desktop, we need to run the debugger on a desktop that has not hung. Of our options, we will look at doing remote access to the computer where our graphics is to be debugged. This will also be helpful in case we accidentally hang the GPU for real!
In the next post we will look at setting up a development environment and then onto implementation.
Footnotes and glossary
Image from Tightening Up the Graphics: Tools and Techniques for Debugging and Optimization ↩
it is important to remember that the vector here is in the SIMD sense and not related to
vecNorfloatNin GLSL/HLSL. ↩it is also possible to directly write the
PCvias_setpcands_swappc. ↩From the RDNA whitepaper ↩
On newer AMD hardware, the SGPR allocation is fixed - so perhaps this is no longer required. ↩